Postprocessing of Edic routing model
Author: Thorsten Arnold
Version: September 15,
2007
Contact: rt.arnold@web.de
Script generated with MatLab,
edited.
Contents
- Select month
and year
- Position and
Radius of pie graph with "Total"
- Define content
of MPMAS output file [SIMNAME]w##.out
- Load EDIC data
and create routing dot file
- Analyse strahler order of all sectors and write to file
- Define position
of pie graphs by hand, or load from file
- LOAD SECTOR DATA
- Filter output
rows: one month, one year
- PLOT SOIL TYPES
- PLOT IRRIGATION METHODS
- PLOT ORIGIN OF WATER
- PLOT DESTINATION / USE OF WATER
- CREATE EXPORT TABLE
- (Brief) Explaination on Calibration
THE STUDY AREA
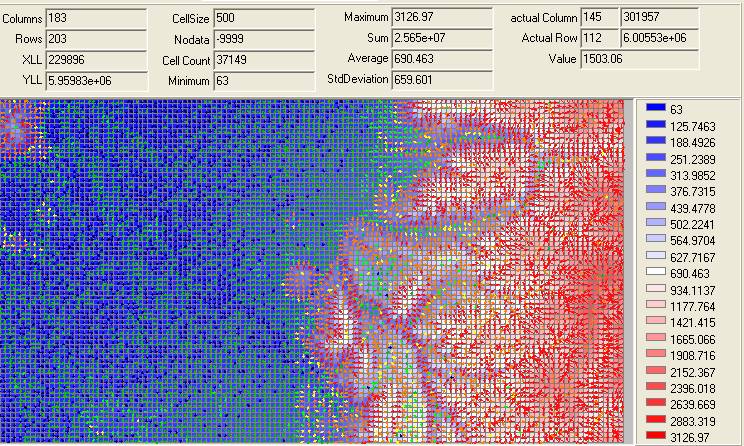
Elevation model and slope gradient

Irrigation sectors of study area (delineated by
consortium Edic)
Initialization of postprocessing
% close open figures
% close all
% clear memory
clear all
global SLASH
SLASH='\'; dirInput='edicData';
dirOutput='outputEdic';
% ----------------------------------------
Select month and year
period=1;
month=3;
% ----------------------------------------
Position and Radius of pie graph
with "Total"
r=25;c=300;radius = 50;
PositionTotal=[r c radius];
% Re-size area of pie graphs. Could be changed for single plot as well,
% then directly before call!
resizeFactor=3.5;
% ----------------------------------------
Define content of MPMAS output file
[SIMNAME]w##.out
(must match
content of output file, but also content of legend)
SCRIPT_defineColumns;
% (here, the content of each column of the output file D_w01.out” is specified.
% This has to be updated if the file’s order is modified! )
% ----------------------------------------
Load EDIC data and create routing dot
file
fileNameEdicXls=[dirInput SLASH 'EDIC_routing_ForDotFile_nolinks.xls'];
[filenameImagePng, XLS_Sheet1, XLS_Sheet2, clusterNames, legendNames] = ... createRoutingGraphWithDotForEdic(fileNameEdicXls, 2);% ... call IrfanView to print result to screen
system(filenameImagePng);
% ----------------------------------------
Looking for EXCEL-File <edicData\EDIC_routing_ForDotFile_nolinks.xls> in current directory Sheetname expected: <ClusterNames> Sheetname expected: <Colors> Sheetname expected: <Legend> Sheetname expected: <sheet1> 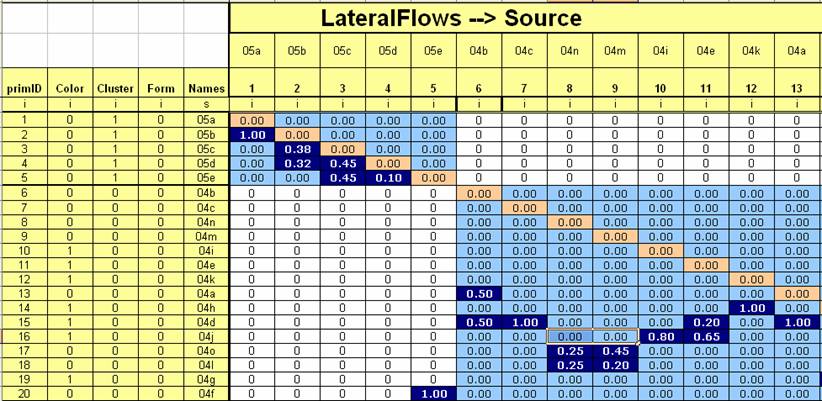
Sheetname expected: <sheet2> Header lines : <4> 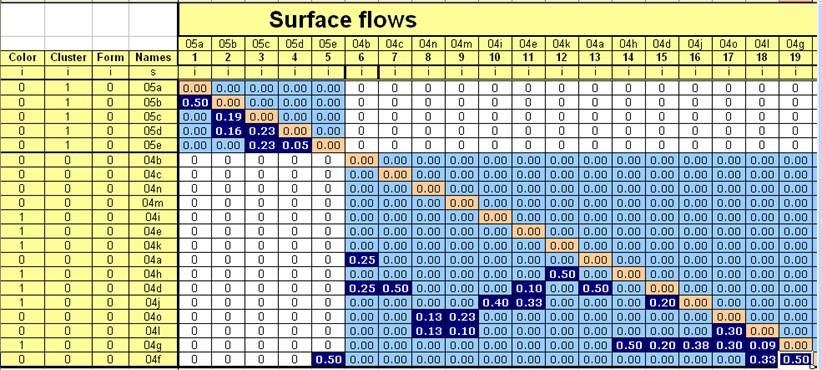
XXXXXXXXXXXXXXXXXXXXXXXXXXXXXXXXXXXXXXXXXXXXXXXX CREATING FILE: outputEdic\sheet2_FUSION.dot Call to system:dot -Tpng -ooutputEdic\sheet2_FUSION.png outputEdic\sheet2_FUSION.dot
Created graph from dot-file <outputEdic\sheet2_FUSION.dot>: Filename: outputEdic\sheet2_FUSION.png (grey sectors are marked with color 1, rest with color 0.) 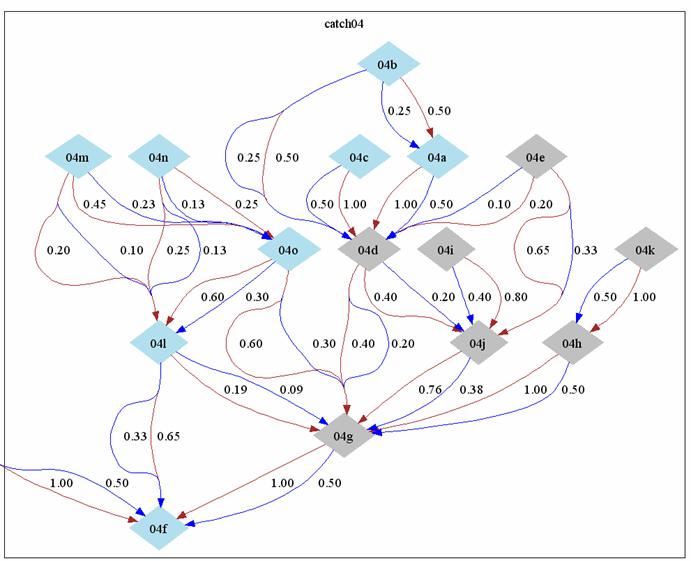
( … figure not showing full plot) Eventually close irfanview or other viewer to continue!
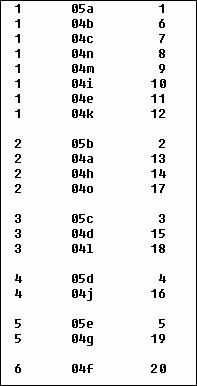
Analyse strahler
order of all sectors and write to file
v= XLS_Sheet1.VAL + XLS_Sheet2.VAL;[allOrder, isolatedNodes] = analyseOrder(v); filenameOrderAsText=[dirOutput SLASH 'StrahlerOrderOfSectors.txt']
filenameOrderAsLatexTable=[dirOutput SLASH 'StrahlerOrderLatexTable.txt']
printOrderToFile(filenameOrderAsText, allOrder, isolatedNodes, XLS_Sheet1, filenameOrderAsLatexTable);
-----------------------------------Created file with table:outputEdic\StrahlerOrderOfSectors.txt
Define position of pie graphs by
hand, or load from file
imagePng= imread(filenameImagePng);
fnPosition=[dirOutput SLASH 'EdicPositions.mat'];
if length(dir(fnPosition))==0
[X, Y]=getPositionOfAllSectors(XLS_Sheet1, imagePng) save(fnPosition, 'X', 'Y', '-ASCII')end
load(fnPosition,'-ASCII');
% Define struct: Information on sectors
activeSectors=find(EdicPositions(1,:)>0);
sectorInfo.Xcoord=EdicPositions(1,activeSectors);
sectorInfo.Ycoord=EdicPositions(2,activeSectors);
sectorInfo.NAMES=XLS_Sheet1.NAMES(activeSectors);
LOAD SECTOR DATA
fileNameWaterFile=[dirInput SLASH 'D_w01.out'];
waterOutputBySector=load(fileNameWaterFile);
% ----------------------------------------
Filter output rows: one month, one
year
period=1; month=3;
% ... Column of time tuples that are active: Intersect month and period
vectorPeriod =waterOutputBySector(:,columnPeriod);
vectorMonth =waterOutputBySector(:,columnMonth);
indexPeriod =find(vectorPeriod==period);
indexMonth =find(vectorMonth==month);
activeRows =intersect(indexPeriod, indexMonth);
if length(activeRows)==0
disp('Error: For this time frame, no output rows were activated.') disp(' Could be input error. Check definition of columns, in SCRIPT <SCRIPT_defineColumns>.')end
clear vectorPeriod vectorMonth indexPeriod indexMonth
PLOT SOIL TYPES
----------------------------------------
activeColumns=columnsSoilTypes;
activeMatrixOfData=waterOutputBySector(activeRows, activeColumns);
activeLegend=legendNames.STRING(activeColumns);
h=figure(1)titleStr='Share of soil types in sector';
plotPieGraph_withoutBackground(activeMatrixOfData, sectorInfo, activeLegend, PositionTotal, [], resizeFactor, titleStr)
% Switch of axis
set(gca, 'XTick', []);
set(gca, 'YTick', []);
fn=[dirOutput SLASH 'FigureSoilTypes']
saveas(h,fn,'fig')
saveas(h,fn,'png')
Exporting figure:outputEdic\FigureSoilTypes.fig (can be modified by hand!)
outputEdic\FigureSoilTypes.png

PLOT IRRIGATION METHODS
----------------------------------------
Get columns of irrigation methods
activeColumns=columnsMethods;
activeMatrixOfData=waterOutputBySector(activeRows, activeColumns);
activeLegend=legendNames.STRING(activeColumns);
% Add column with rainfed/fallow. This is the difference from all irrigated
% areas and the total sector size
vectorTotalSize=waterOutputBySector(activeRows, columnTotalArea);
vectorRestArea=vectorTotalSize - sum(activeMatrixOfData,2);
% add column to matrix
activeMatrixOfData=[activeMatrixOfData vectorRestArea];
% add entry to legend
activeLegend(length(activeColumns)+1)={'Rainfed/fallow'};
h=figure(2)titleStr='Share of irrigation methods';
plotPieGraph_withoutBackground(activeMatrixOfData, sectorInfo, activeLegend, PositionTotal, [], resizeFactor, titleStr)
% Switch of axis
set(gca, 'XTick', []);
set(gca, 'YTick', []);
% Save
fn=[dirOutput SLASH 'FigureIrrigationMethods']
saveas(h,fn,'fig')
saveas(h,fn,'png')
clear vectorTotalSize vector RestArea;
Exporting figure:outputEdic\FigureIrrigationMethods.fig (can be modified by hand!)
outputEdic\FigureIrrigationMethods.png

PLOT ORIGIN OF WATER
----------------------------------------
activeColumns=[columnInflowsFreshwater columnInflowsReturnFlows];
activeMatrixOfData=waterOutputBySector(activeRows, activeColumns);
activeLegend={'Freshwater inflows'; 'Return flows'};
h=figure(3)titleStr='Origin of water';
plotPieGraph_withoutBackground(activeMatrixOfData, sectorInfo, activeLegend, PositionTotal, [], resizeFactor, titleStr)
% Switch of axis
set(gca, 'XTick', []);
set(gca, 'YTick', []);
% Save
fn=[dirOutput SLASH 'FigureInflows']
saveas(h,fn,'fig')
saveas(h,fn,'png')
Exporting figure:outputEdic\FigureInflows.fig (can be modified by hand!)
outputEdic\FigureInflows.png

PLOT DESTINATION / USE OF WATER
----------------------------------------
activeColumns=[columnWateruseSurfaceRunoff columnWateruseLateralFlow];
activeMatrixOfData=waterOutputBySector(activeRows, activeColumns);
activeLegend={'Surface runoffs (reusable)'; 'Lateral runoffs (reusable)'; 'Evapotranspiration'; 'Loss'};
% Total evapotranspiration: Demand satisfied * efficiency eta
vectorEtp=waterOutputBySector(activeRows, columnEtaEvapotranspiration) .* waterOutputBySector(activeRows, columnWaterdemandSatisfied);
% Losses
columnLossFactor_loss_j=21;
columnLossFieldlevel_L_j=24;
vectorLosses=waterOutputBySector(activeRows, columnLossFactor_loss_j) .* waterOutputBySector(activeRows, columnLossFieldlevel_L_j);
% final matrix
activeMatrixOfData=[activeMatrixOfData vectorEtp vectorLosses];
h=figure(4)titleStr='Destination of water flows';
plotPieGraph_withoutBackground(activeMatrixOfData, sectorInfo, activeLegend, PositionTotal, [], resizeFactor, titleStr)
% Switch of axis
set(gca, 'XTick', []);
set(gca, 'YTick', []);
% Save
fn=[dirOutput SLASH 'FigureDestination']
saveas(h,fn,'fig')
saveas(h,fn,'png')
Exporting figure:outputEdic\FigureDestination.fig (can be modified by hand!)
outputEdic\FigureDestination.png

CREATE EXPORT TABLE
FOR CALIBRATION OF FACTORS b_j AND
g_j
----------------------------------------
filenameEdicFactorTable=[dirOutput SLASH 'edicTableOfFactors_' num2str(period) '_' num2str(month)]
createTableOfEdicFactors(filenameEdicFactorTable, waterOutputBySector(activeRows, :), sectorInfo.NAMES);
Filename of output:outputEdic\edicTableOfFactors_1_3.tsv (here loaded into Excel and colored by hand.) 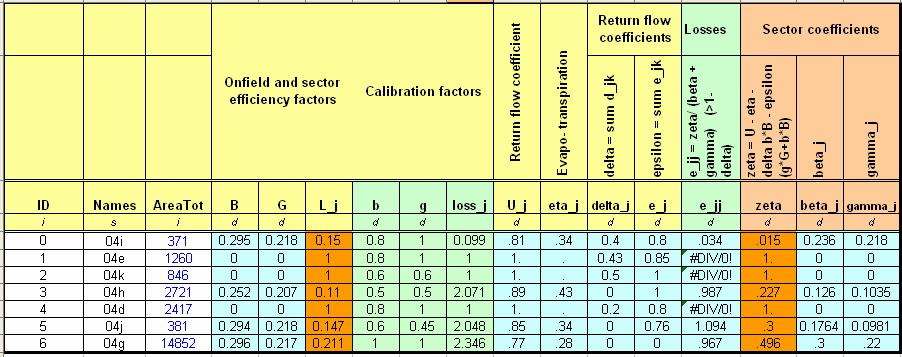
First, check consistency of on-field losses L_j
and sector-wise losses zeta_j.
EXPLAINATION ON CALIBRATION
First, check consistency of on-field losses L_j
and sector-wise losses zeta_j.
If zeta is negative, then adjust calibration factors b and g, and loss_j follows
from
the balance relation (see Manual).
If delta_j and epsilon_j,
which are the sum of all outgoing return flow
coefficients, are less than one, then this additional share of water needs
to be
included into the loss coefficient.
This calibration can be done in Excel, once “kind of realistic” land
uses
and
irrigation methods (and thus B_j, G_j,
L_j) are determined.